Highly-determined Data Science graduate having 3+ years of experience using ML, text mining, and deep learning algorithms to solve challenging problems. Received “Exceeds Expectations Award” for developing Automated analytical tool that resolved issues 40% faster and reduced the incident tickets by 33%. Strong accomplishment of building unique data science applications, now aspiring to bring actionable solutions to real-time industry problems.
MS in Business Analytics - Specilization in Data Science, 2020
University of Illinois at Chicago
Bachelors in Electronics and Communication Engineering, 2016
Chaitanya Engineering College
90%
100%
10%
Prediction of Diabetes from Lumiata Claims dataset
Identification of Leader words from any local meaning
Sentiment Analysis of Product Reviews
Twitter Topic Modeling Application
Performed statistical analysis of FI and SD data and suggested tangible solutions to stakeholders by visualizing the KPI metrics in Tableau.
Streamlined workflows and built applications in SAP business modules deploying the applications using the IBM TWS tool.
Optimized complex SQL Queries for faster data processing which improved the speed and efficiency of applications by 28%.
Key achievement: Received “Pat on the Back Award” for spearheading the whole team and managing adhoc requests during challenging time.
Developed an Automated Data Cleaning App which performs 15 most important data cleaning features i.e. handling missing values, correlation tests, statistical tests, balancing dataset using sampling techniques etc. It reduces the overall data cleaning time by nearly 30-40%.
Transformed data using Spark RRD operations on 5000K reviews. Built a product recommendation system using ALS Collaborative Filtering obtaining an RMSE value of 0.91. The data set contains data for 287,209 products with 5,074,160 reviews and ratings by 1, 57,386 users.
Objective of this assignment is to extract some sections (which are mentioned below) from SEC / EDGAR financial reports and perform text analysis to compute variables those are explained below. Link to SEC / EDGAR financial reports are given in excel spreadsheet “cik_list.xlsx”.
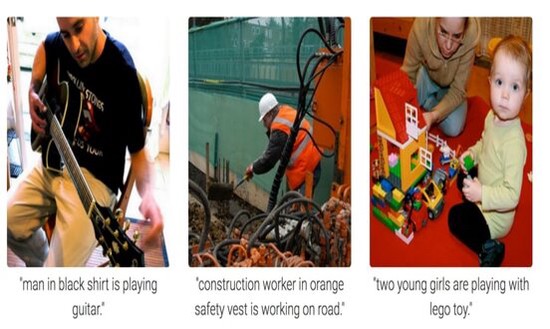
Built an Image Captioning system using Encoder CNN and Decoder LSTM with an attention mechanism to generate relevant captions for any input image. Analyzed the results using BLEU 3, 4 metrics, and deployed the model in real-time using Amazon SageMaker.
Calculated similarity between the documents ‘UIC’ with ‘UIUC’, ‘MIT’,‘UIS’,‘Tesla’, and ‘Stanford’ text documents. Peformed Jaccard similarity and cosine similarity functions on the text documents and obtained the similarity between UIC and rest of the documents.
Developed a English news to Telugu language translator application using LSTM. Encased the application in Flask and orchestrated it on AWS by pushing the containerized Flask application to AWS Linux EC2 instance deploying the application in-live.
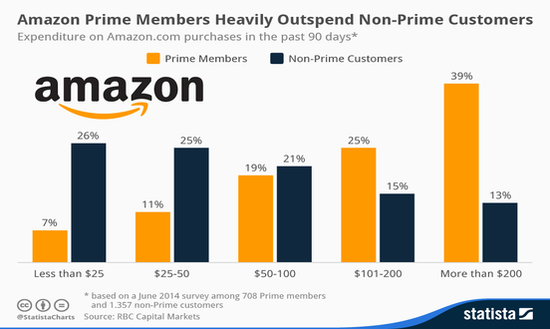
Performed Apache Spark operations and found out the list of customers who are active on Amazon. This would be helpful to Amazon as it is conducting an A/B testing experiment on potential target users and want to know if customers list which they have are ACTIVE users or not.
Performed Image Classification system using CIFAR10 dataset by implementing 4 different neural networks i.e. Softmax, TwoLayerNN, ConvNet and my own model(MyModel), after which obtained the best performance i.e. 92% accuracy on my own customerized model “MyModel”.
Developed a mapper reducer function which can perform the same functionalities of a mapper reducer used in big data applications. Implemented Multi-threading operations for faster functionality of Mapper-Reducer function by parallel processing of data.
Created an interactive dashboard that visualized the impact of mobility in different areas on the new covid19 cases. Proven the results both visually in Tableau and statistically using a Linear regression model showing that the mobility in parks is causing high number of new cases.
Built a predictive model to find the risk of diabetes in patients using Insurance Claims dataset. Featurized the Insurance claims data, and train and optimize a predictive SVC model and found out probability of diabetes in each patient.
Transformed data using Spark RRD operations on 5000K reviews. Built a product recommendation system using ALS Collaborative Filtering obtaining an RMSE value of 0.91. The data set contains data for 287,209 products with 5,074,160 reviews and ratings by 1, 57,386 users.
Created an interactive screening tool using R Shiny that predicts the risk of having a chronic Kidney disease using the Logistic regression model attaining 97% recall. The screening tool can be used by doctors in finding the probablity of Chronic Kidney Disease in patients.
Created interactive dashboards to visually represent KPIs for for the performance of SkyWest Airlines in the United States. Analyzed the metrics like airlines delay, cause of delays etc. and compared it’s performance with the rest of the US airlines.
Analyzed Twitter Sentiment by implementing Logistic Regression from scratch. Used twitter dataset having 1 million tweets and applied logistic regression on it to find the sentiment associated with each tweet which would help in classifying of tweets.
Predicted the department wise sales for 45 Walmart stores modeling the effects of markdowns on holidays using the ARIMA and Holt-Winters model. The historical sales data is provided for 45 Walmart stores and each store contains a number of departments.
Performed word embeddings using Glove on the wikipedia document of ‘UIC’ and created a scatter plot to see the clusters of the projections. These embeddings are a type of word representation that allows words with similar meaning to have a similar representation.